

Birthday Problem
The birthday problem pertains to the probability that in a set of randomly chosen people some pair of them will have the same birthday. Specifically, the birthday problem asks whether any of the 23 people have a matching birthday with any of the others.
In a list of 23 persons, if you compare the birthday of the first person on the list to the others, you have 22 chances of success, but if you compare each to the others, you have 253 chances.
This is because in a group of 23 people there are 23*22/2=253 pairs, which is more than half of the number of days in the year. So the chance that one of these pairs has a matching birthday is not small.
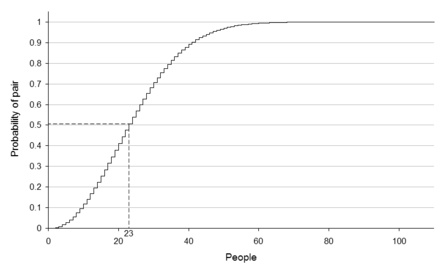
In a group of 23 (or more) randomly chosen people, there is more than 50% probability that some pair of them will have the same birthday.
For 57 or more people, the probability is more than 99%, tending toward 100% as the pool of people increases.
To compute the approximate probability that in a room of n people, at least two have the same birthday, we disregard variations in the distribution, such as leap years, twins, seasonal or weekday variations, and assume that the 365 possible birthdays are equally likely. Real-life birthday distributions are not uniform since not all dates are equally likely.
It is easier to first calculate the probability p(n) (where p(n) = 1 − p(n)) that all n birthdays are different. If n ≥ 365, by the pigeonhole principle this probability is 0. On the other hand, if n ≤ 365, it is given by:
The above holds true since the second person cannot have the same birthday as the first (364/365), the third person cannot have the same birthday as the first two (363/365), etc.
Therefore, the event of at least two of the n persons having the same birthday is complementary to all n birthdays being different. Therefore, its probability p(n) is:
p(n) = 1 − p(n)
This probability surpasses 0.5 for n = 23 (with value approximately 50.7%).
The following table shows the probability for some other values of n. The values listed within the table ignore the existence of leap years, as described above.
| n | p(n) |
|---|---|
| 10 | 12% |
| 20 | 41% |
| 23 | 50.7% |
| 30 | 70% |
| 50 | 97% |
| 100 | 99.99996% |
| 200 | 99.9999999999999999999999999998% |
| 300 | (100 − (6×10−80))% |
| 350 | (100 − (3×10−129))% |
| 366 | 100% |